Pitfalls of time capnography
Time capnography is a convenient method, commonly used in anesthetic practice to monitor ventilation. There are, however, subtle but important limitations of this process.1
1. The V/Q status of the lung is more accurately reflected in the slope of phase III in an SBT CO2 trace (volume capnogram) than in that of a time capnogram, in which the gradient of phase III slope is usually less obvious. This may be because a smaller volume of expired gases (approximately the final 15%) occupies half the time available for expiration, so that a similar change in FCO2 is distributed over a greater length of time in the time capnogram than the SBT-CO2 trace.2,3
2. Unlike an SBT-CO2 trace, the physiological dead space and CO2 output cannot be determined from a time capnogram as currently recorded.
3. Presently, the available time capnographs do not distinguish the end of expiration from the beginning of inspiration. This drawback makes the analysis of time capnograms during inspiration difficult, and results in an inaccurate assessment of rebreathing, which is grossly underestimated. This explained further below.4
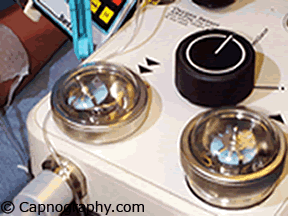
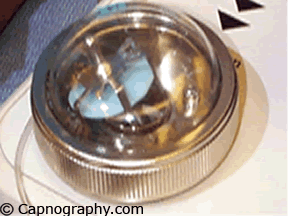
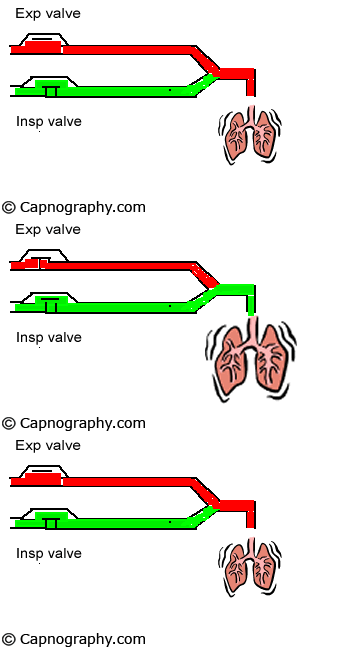
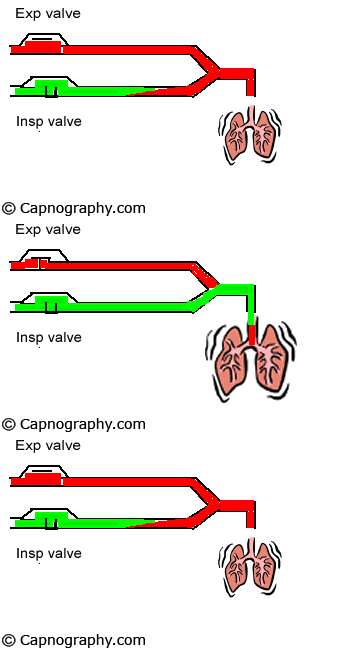
A major limitation of the time capnogram is its inability to detect rebreathing expeditiously as a result of an incompetent inspiratory valve in the standard anesthesia circle circuit.4,5 This is because the division of a time capnogram into inspiratory and expiratory segments is arbitrary.6,7 Inspiration is generally assumed to occur when the carbon dioxide (CO2) concentration decreases rapidly to the baseline towards the end of the expiratory alveolar plateau, and expiration to occur a few moments before the beginning of the expiratory upstroke. An incompetent inspiratory valve will allow exhaled CO2- containing gas to enter the inspiratory limb of the circuit during expiration (see animation below).
| Displaced Inspiratory valve | Close up view |
 |
 |
| Normal Inspiratory valve function=CO2 | Inspiratory valve Incompetent |
 |
 |
 |
 |
| Plateau is prolonged due to rebreathing |
During the next inspiration, the CO2-containing gas in the inspiratory limb enters the patient, extending the expiratory alveolar plateau (phase III) of the time capnogram. A decrease in CO2 follows the extended alveolar plateau and represents the appearance of the CO2-free gas from the machine-end of the inspiratory limb. During this latter phase of inhalation, CO2 concentration may reach zero. The capnogram thus created may be indistinguishable from the normal capnogram, at least during the initial phase of rebreathing. The time capnograph is unable to reveal rebreathing because it is unaware of the beginning of actual inspiration.4 It assumes that inspiration commenced at the start of the downstroke of the CO2 waveform. Bhavani-Shankar et al.4 has suggested that marking the end of expiration and the beginning of inspiration on a time capnogram should enable sensitive detection of rebreathing and identify a defective circle system. One of the methods suggested was to superimpose inspiratory and expiratory flow rates on the capnogram.4
A Novametrix® CO2- SMO plus respiratory profile monitor was used to obtain a simultaneous display of CO2 and respiratory flow waveforms on a computer screen during spontaneous as well as controlled ventilation. A circle system was used with the inspiratory valve competent (no rebreathing) as well as with the valve displaced (rebreathing).8 As the response time of the CO2 analyzer was similar to the response time of the flow sensor, a comparison was made between the two waveforms to determine the inspiratory segment (phase 0), and the expiratory segment and its subdivisions (phases I, II and III) of the time capnogram. The end of expiration almost coincides with the downslope of the CO2 waveform in the capnograms when there is no rebreathing ( figure A). However, in the presence of rebreathing, the alveolar plateau is prolonged (figure B) and includes a part of inspiration (phase 0) in addition to the expiratory alveolar plateau (phase III).
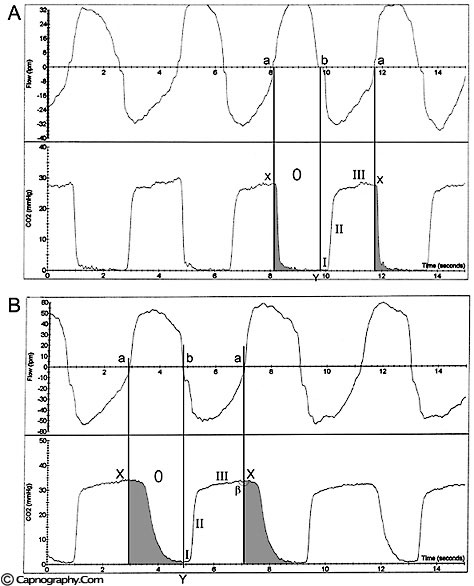
Breen and Bradley5 suggested that CO2 spirography (CO2 concentrations versus inspired and expired volume during respiratory cycle) should be used to detect rebreathing in situations in which rebreathing is not detected by time capnography. By multiplying and integrating airway-measured flow and PCO2, they computed overall expired and inspired VCO2 (CO2 volume) during intermittent positive pressure ventilation in a circle anesthesia circuit. They also recorded time capnograms. The time capnogram did not show appreciable changes when the inspiratory valve was made incompetent. They found, however, a significant increase in inspired VCO2 when the inspiratory valve was compromised, suggesting rebreathing. They concluded that CO2 spirography (in contrast to time capnography) is required to detect inspiratory valve incompetence during mechanical ventilation. However, the method suggested by Breen and Bradley5 is complex and may not be suitable for routine clinical use.
Comparison between respiratory flow rate waveforms and CO2 waveforms to determine inspiratory and expiratory segments of the time capnogram, can be easily facilitated in the monitors that use mainstream CO2 measurement technology as described above in the Novametrix® SMO-CO2 analyzer. Capnographs using side-stream sensor technology may not allow comparison between CO2 waveforms and flow rate waveforms because of the longer response time of side-stream CO2 analyzers, which occurs as a result of the 6-ft sampling tube. It may be, however, that an algorithm can be built into the software of side stream capnographs to allow correction for a delayed CO2 response and thus facilitate the comparison between the two waveforms.
The simultaneous display of flow waveforms and time capnograms allows easy delineation of the inspiratory and the expiratory portions of time capnograms. This facilitates expeditious detection of rebreathing, even before the increase of the baseline (phase 0) or a subsequent increase in end-tidal PCO2 as a result of rebreathing. Moreover, delineation of segments also helps in the differential diagnosis of abnormal CO2 waveforms. As for example in a recent case report,9 the authors were unable to promptly diagnose rebreathing (produced as a result of failure of CO2 absorption by the soda lime during closed circuit anesthesia) because the resulting abnormal capnogram had two curves (a second peak following the primary peak). The differential diagnosis of such a capnogram could be a curare cleft (if the second peak occurred during expiration), or a signature capnogram (if the second peak occurred during inspiration).6 The authors finally localized the fault to a totally exhausted soda lime whose change of color was concealed by the colored tint of the plastic container.9 By this time there was substantial rebreathing resulting in an increase in end-tidal PCO2 and possibly hypercarbia.
In addition, delineating various components of a time capnogram would widen the scope for future applications of time capnography. For example, it would permit the identification of any differences between end-tidal CO2 (at the end of expiratory flow) and end-expiratory pause CO2 (at the beginning of inspiratory flow) particularly during low frequency ventilation. Normally, both these values are similar when the phase III is flat. However, the difference between the two assumes importance in time capnograms where the slope of phase III is steep (chronic obstructive pulmonary diseases). This distinction may result in a more accurate prediction of arterial PCO2 using time capnography. Furthermore, the demarcation of the expiratory segment may allow the exploration of estimating physiological dead space and its components using a time capnogram as is currently possible in a volume capnogram (single breath test-CO2 curve). However, it is premature to predict whether the clinical benefits of including flow data into present capnographic technology would outweigh the economic cost involved, and further studies are required.
References:
1. Bhavani-Shankar K, Kumar AY, Moseley HSL, Hallsworth RA. Terminology and the current limitations of time capnography: A Brief Revew. J Clin Monit 1995;11:175-82.
2. Fletcher R. The single breath test for carbon dioxide (Thesis). Lund, Sweden, 1980.
3. Fletcher R, Jonson B, Cumming G, Brew J. The concept of dead space with special reference to the single breath test for CO2. Br J Anaesth 1981;53:77-88.
4. Yasodananda Kumar A, Bhavani-Shankar K, Moseley HSL, Delph Y. Inspiratory valve malfunction in a circle system: pitfalls in capnography. Can J Anaesth 1992;39:997-9.
5. Breen PH, Bradley PJ. Carbon dioxide spirogram (but not capnogram) detects leaking inspiratory valve in a circle circuit. Anesth Analg 1997;85:1372-6.
6. Bhavani-Shankar K, Moseley H, Kumar AY, Delph Y. Capnometery and Anaesthesia: Review article. Can J Anaesth 1992;39:6:617-32.
7. Bhavani-Shankar K, Kumar AY, Moseley HSL, Ahyee-Hallsworth R. Terminology and the current limitations of time capnography: A brief review. J Clin Monit 1995;11:175-82.
8. Bhavani Shankar K, Philips J. Defining Segments and Phases of a Time Capnogram. Anesthesia Anelgesia 2000;91:4:973-7.
9. Pond D, Jaffe RA, Brock-Utne JG. Failure to detect CO2-absorbent exhaustion: Seeing and Believing. Anesthesiology 2000;92:1196-8.

 Twitter
 Youtube

