Follow Capnography / Bhavani Shankar Kodali     Twitter   Youtube

A Comprehensive Educational Website (established 1998)

Designed, Produced, and maintained (Edition 12, 2022) by 

Bhavani Shankar Kodali MD

Updated September 2022

What happens to PETCO2 when there is pneumothorax?

What happens to PETCO2 when there is pneumothorax?


I have been asked this question by several colleagues. The answer, however, is not simple. It depends on the status of a pneumothorax (evolution), cause of pneumothorax, and the content of the pneumothorax (air/oxygen/nitrous oxide versus carbon dioxide). Pneumothorax can affect the PETCO2 as well as the shape of the capnograms.

If the pneumothorax is progressing towards a tension pneumothorax, then obviously the PETCO2 will decrease due to decreases in cardiac output.

pnx

If a pnemothorax is small, one may not find any difference, and therefore it is non-diagnostic. However, as the pneumothrorax increases in size, the changes in capnography depend on the tidal volume delivered which is a function of the mode of ventilation, i.e., 'pressure controlled' versus 'volume controlled'. If pressure controlled, then tidal volume will decrease, resulting in a gradual increase in the PaCO2 and PETCO2 as well (hypoventilation). However, the PETCO2 may decrease due to inadequate sampling of alveolar CO2 due to the tidal volume becoming progressively smaller. Moreover, as tension pneumothorax increases in size, thereby decreasing cardiac output, PETCO2 decreases. A volume controlled ventilation is more likely to increase intra-thoracic pressure with increasing pnuemothorax which imposes a mechanical impedance to the circulation and results in a decrease in PETCO2.1

If the cause of pneumothorax is due to an obstruction to exhalation, an obstructive capnogram (prolonged phase II and increased slope of Phase III) with increasing PETCO2 can be observed. In a case report by Smith et al,1 a normal capnogram changed to an obstructive picture in 45 minutes, following the induction of general anesthesia and IPPV. Ventilation was increased to offset increasing PETCO2. Ten minutes later, circulatory collapse occurred with decreasing end-tidal PCO2 to 15 mm Hg. Examination of the chest revealed bilateral tension pneumothorax. Although capnography was being used continuously, the altered CO2waveform that occured went unrecognized. The authors retrospectively felt that important diagnostic clue could have led the authors to search for and correct the cause of expiratory obstruction very early in the evolution of this event. The cause of the pneumothorax was a defective bacterial filter of the breathing circuit.

An obstructive pattern on a capnogram has been reported when a patient developed pneumothorax during laparoscopic Nissen fundoplication.2 There was also an increase in peak inspiratory pressures and wheezing was also noted on ascultation. Several puffs of albuterol nebulizations were administered which resulted in a cessation of the wheezing. However, the obstructive pattern on the capnogram persisted. There was a gradual decrease in the oxygen saturation towards the conclusion of the surgery. A postoperative X-ray revealed a 100% left-sided pneumothorax.

bronch

The obstructive pattern on the capnogram is probably due to compression of the airways by the pneumothorax.

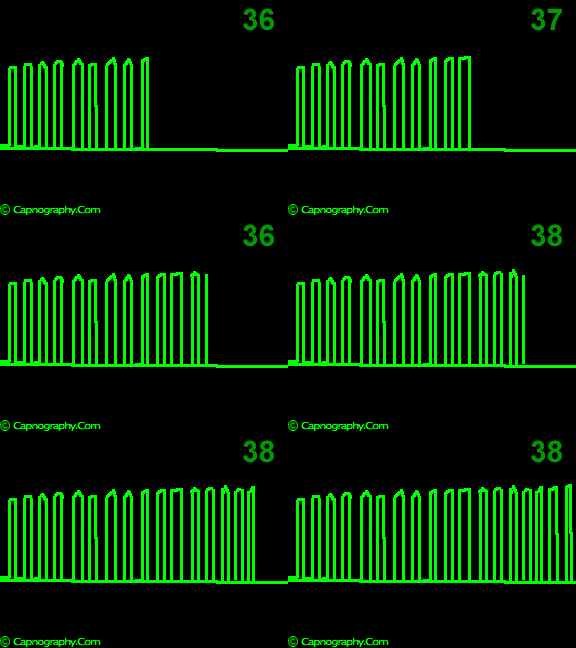
Reports of characteristic changes of the descending limb can be found in the literature. A staircase effect on the descending limb of the capnogram is seen in the presence of a pneumothorax in neonates.3,4 When chest tubes are correctly positioned, a staircase effect may indicate chest tube occlusion.3

tpnx

Carbon dioxide pneumothorax:Capnopneumothorax

When pneumothorax occurs as a complication of CO2 induced pneumoperitoneum, it results in an increase in the PETCO2.5-9 This could be an early warning sign of CO2 pnuemothorax when associated with increases in the peak inspiratory pressure. In one study, PETCO2 and PaCO2 increased in all patients who developed CO2 pneumothorax, and ventilation was increased to offset increases in PETCO2.5 However, no changes in CO2 waveform were observed in this study. In a retrospective of 968 laparoscopic surgical cases, PETCO2 greater than 50 mm Hg and operative times greater than 200 minutes were predictors of the development of pneumothorax and/or pneumomediastinum.9

capnopnx

If pneumothorax is not diagnosed and it progresses into a tension pneumothorax, then it may result in a decrease in PETCO2 secondary to circulatory collapse.


1. Smith EC, Otworth JR, Kaluszyk, P. Bilateral tension pneumothorax due to a defective anesthesia breathing circuit filter. J Clin Anesth 1991;3:229-234.

2. Manger D, Kirchhoff GT, Leal JJ, Laborde R, Fu E. Pneumothorax during laparoscopic Nissen fundoplication.

3. Smalhout B, Kalenda Z. An Atlas of Capnography. Kerckebosche Zeist.The Neterhlands. 2n ed. 1981:163.

4. Curley MAQ, Thompson JE. End-tidal CO2 monitoring in critically ill infants and children. Pediatric Nursing 1990;16;397-403.

5. Joris JL, Chiche JD,Lamy ML. Pneumothorax during laproscopic fundoplication: diagnosis and treatment with positive end-expiratory pressure. Anesth Analg 1995;81:993-1000.

6. Perke G, Fernandez A. Subcutaneous emphysema and pneumothorax during laparoscopy for ectopic pregnancy removal. Acta Annesthesiol Scan 1997;41(6):792-4.

7. Peden CJ, Prys-Roberts C. Capnothorax: implications for the anaesthetist. Anaesthesia 1993;48:664-6.

8. Chui PT, Gin T, Chung SC. Subcutaneous emphysema, pneumomediastinum and pneumothorax complicating laparoscopic vagotomy. Anaesthesia 1993;48(11):978-81.

9. Murdock CM,Wolff AJ, Van GeemT. Risk factors for hypercarbia, subcutaneous emphysema, pneumothorax, and pneumomediastinum during laparoscopy. Obstet Gynecol 2000;95:704-9.

Cardiac output and PETCO2


Cardiac output and PETCO2

During steady-state gas exchange equilibrium, the alveolar PCO2 (PACO2), tissue CO2 production (VCO2), and alveolar ventilation (VA) are related as given by the following equation:

PACO2 = (K)VCO2/VA

During constant ventilation and CO2 production, an abrupt reduction in cardiac output (Qt) reduces PECO2.1-7 This may occur because of two mechanisms.1,2

(1) A reduction in venous return causes a decrease in CO2 delivered to the alveolar compartment, resulting in decreased PACO2. The percent decrease in PETCO2 is directly correlated with the percent decrease in cardiac output (slope= 0.33, r2=0.82 in 24 patients undergoing aortic aneurysm surgery with constant ventilation).1 Also, the percent decrease in CO2 elimination is similarly correlated with the percent decrease in cardiac output (slope=0.33, r2=0.84).1 The changes in PETCTO2 and CO2 elimination following hemodynamic perturbation were parallel. These findings suggest that decrease in PETCO2 quantitatively reflect the decreases in CO2 elimination.1

(2) An increase in alveolar dead space, which results from the decreased pulmonary vascular pressure, will dilute the CO2 from normally perfused alveolar spaces to decrease PETCO2 below PACO2.

During sustained reduction in cardiac output, however, increasing CO2 accumulation in the peripheral tissues and venous blood will begin, after 10-20 min, to restore CO2 delivery to the lungs and PETCO2 toward baseline levels.

Reciprocal changes in PETCO2 will occur during acute increases in CO2. Increases in cardiac output and pulmonary blood flow result in better perfusion of the alveoli and a rise in PETCO2.3,4 Consequently alveolar dead space is reduced as is (a-ET)C02 The decrease in (a-ET)PC02 is due to an increase in the alveolar C02 with a relatively unchanged arterial C02 concentration, suggesting better excretion of C02 into the lungs. The improved C02 excretion is due to better perfusion of upper parts of the lung.2 The relationship between PETCO2 and pulmonary artery blood flow was studied during separation from cardiopulmonary bypass.5 This showed that PETCO2 is a useful index of pulmonary blood flow. A PETCO2 greater than 30 mm Hg was invariably associated with a cardiac output more than 4 L/min or a cardiac index > 2 L/min.5 Furthermore, when PETCO2 exceeded 34 mm Hg, pulmonary blood flow was more than 5 L/min (CI > 2.5 L).5

Thus, under conditions of constant lung ventilation, PETCO2 monitoring can be used as a monitor of pulmonary blood flow.2,5-8

Recently, using Fick's Principle, attempts were made to determine cardiac output non-invasively implementing periods of CO2 rebreathing during which CO2 partial pressure of oxygenated mixed venous blood is obtained from the measured exponential rise of the PETCO2 value. In addition, oxygen uptake, carbon dioxide elimination, end-tidal PCO2, oxygen saturation, and tidal volume were determined. These results are encouraging in patients with healthy lungs.9 Whereas the results are considered controversial when the lungs are diseased.10

References:

1 Shibutani K, Muraoka M, Shirasaki S, Kabul K, Sanchala VT, Gupte P. Do changes in end-tidal PCO2 quantitatively reflect changes in cardiac output? Anesth Analg 1994;79:829-33.

2 Isserles SA, Breen PH. Can changes in end-tidal PCO2 measure changes in cardiac output? Anesth Analg 1991;73:808-14.

3 Leigh MD, Jones JC, Motley HL. The expired carbon dioxide as a continuous guide of the pulmonary and circulatory systems during anesthesia and surgery. J Thoracic cardiovasc surg 1961;41:597-610.

4 Askrog V. Changes in (a-A)CO2 difference and pulmonary artery pressure in anesthetized man. J Appl Physiol 1966;;21:1299-1305.

5 Maslow A, Stearns G, Bert A, Feng W, Price D, Schwartz C, Mackinnon S, Rotenberg F, Hopkins R, Cooper G, Singh A, Loring SH. Monitoring end-tidal carbon dioxide during weaning from cardiopulmonary bypass in patients without significant lung disease. Anesth Analg 2001;92:306-13.

6 Weil MH, Bisera J, Trevino RP, Rackow EC. Cardiac output and end-tidal carbon dioxide. Crit Care Med 1985;13:907-9.

7 Ornato JP, Garnett AR, Glauser FL. Relationship between cardiac output and the end-tidal carbon dioxide tension. Ann Emerg Med 1990;19:1104-6.

8 Jin X, Weil MH, Povoas H, Pernat A, Xie J, Bisera J. End-tidal carbon dioxide as a noninvasive indicator of cardiac index during circulatory shock. Crit care Med 2000;28:2415-9.

9. Gedeon A, Krill P, Kristensen J, Gottlieb I. Noninvasive cardiac output determined with a new method based on gas exchange measurements and carbon dioxide rebreathing: A study in animals/pigs. J Clin Monit 1992;8:267-78.

10. Pianosi P, Hochman J. End-tidal estimates of arterial PCO2 for cardiac output measurements by CO2 rebreathing: a study in patients with cystic fibrosis and healthy controls. Pedatr Pulmonol 1996;22:154-60.

Endobronchial intubation (EBI)


Endobronchial intubation (EBI)


One of the common questions asked by residents is what happens to PETco2 and capnogram during endobronchial Endobronchial Intubation (EBI)?.

Capnography is not a sensitive diagnostic tool of endobronchial intubation (EBI). A study comparing capnography with pulse oximetry in children, showed that pulse oximetry provided the first diagnostic clue in 13 of 14 episodes of EBI; the one event diagnosed by capnography had concurrent desaturation.1

In a 1997 publication from the Australian Incidence Monitoring study, accidental bronchial intubation occurred in 154 of 3947 (3.7%) incidents, and capnography remained normal or unremarkable during 88.5% of the episodes. One-third of the cases were associated with head or neck surgery and possible flexion of the patient's head.2

Lower as well as higher end-tidal Pco2's, however, have been reported during EBI. Riley and Marcy presented a case report where they were able to diagnose endobronchial intubation when there was a rise in end-tidal co2 from 4.1% to 6.1%.3 The rise in end-tidal Pco2 was the result of reduced ventilation consequent to leakage of tidal volumes around a non-cuffed tube migrating into the bronchus, thereby increasing the resistance to ventilation.3 On the other hand, Chang et al 4, have reported a decrease in ETco2 when the endotracheal tube migrated into the bronchus in dogs ventilated under anesthesia and IPPV.4 During EBI with a cuffed tube, and volume cycled ventilation, there is a doubling of alveolar ventilation of one lung resulting in a decrease in PAco2 of the ventilated lung with a significant drop in arterial PO2 with a minimal increase in Paco2. This results in a fall in PETco2.4-6

If a pressure cycled ventilation is used, then PETco2 may rise consequent to hypoventilation. Occasionally, the author has observed an obstructive pattern on the capnogram (with prolonged phase II and steep phase III), during cesarean section general anesthesia. This is due to a partial occlusion of the endobronchial airway, most probably as a result of the endotracheal tube abutting against the wall of the bronchus. The capnogram reverted to a normal shape as soon as the endobronchial tube was repositioned within the trachea.

Gilbert and Benumof7 have reported a biphasic capnogram during endobronchial intubation in a patient with no known lung disease who was found to have a right main-stem bronchial intubation.

Right main stem intubation Endotracheal tube pulled back into the trachea
endobronch
endobronch1

This capnogram probably occurred as the tip of the endotracheal tube changed while moving in and out of the right main bronchus during the respiratory cycle. This resulted in a partial obstruction to gases from the left lung, thereby prolonging expiratory time from the left lung. The initial peak is due to the carbon dioxide from the well-ventilated right lung. The second peak is most likely due to the prolonged expiratory time of the poorly-ventilated left lung.

Therefore, in summary, capnography is a non-sensitive diagnostic tool to detect EBI. PETco2 can increase, decrease, or remain unaltered, depending on the circumstances.

A normal PETco2 and normal capnogram will not rule out EBI. On the other hand, an increased PETco2, reduced PETco2, or an abnormal capnogram should encourage one to consider using EBI in the differential diagnosis of hypoxia or increased peak inspiratory pressures.

References:

1. Rolf N, Cote CJ. Diagnosis of clinically unrecognized endobronchial intubation in peadiatric anaesthesia; which is more sensitive, pulse oxymetry or capnography? Paediatr Anaesth 1992;2:31-5.

2. McCoy EP, Russell WJ, Webb RK. Accidental bronchial intubation: an analysis of AIMS incident reports from 1988 to 1994 inclusive. Anaesthesia 1997;52:24-31.

3. Riley R, Marcy J. Unsuspected endobronchial intubation - Detection by Continuous Mass Spectrometry. Anesthesiology 1985;63:203-4.

4. Chang PC, Reynolds FB, Lang SA, Ha HC. Endobronchial intubation in dogs. Can J Anaesth 1990;37(suppl);S44.

5. Gandhi SK, Mushi CA, Kampine JP. Early warning sign of accidental endobronchial intubation: A sudden drop or sudden rise in PAco2. Anesthesiology 1986;65:114-5.

6. Benumof JL. Monitoring. Anesthesia for Thoracic Surgery. Philadelphia, W.B.Saunders Company;p250.

7. Gilbert D, Benumof JL. Biphasic carbon dioxide elimination waveform with right mainstem bronchial intubation. Anesth Analg 1989;69:829-32 (with permission).

capno-animation lecture tour


Capnography lecture tour 

Bhavani Shankar Kodali MD

 
This is the lecture format I use for giving grand rounds. If you borrow any material from this section for the purposes of teaching capnography, you may do so by acknowledging the source (www.capnography.com).


If you present this material at conferences, please seek prior permission from the author via email.  Commercial use is strictly prohibited

If agree, click here  If not Back to main page

Bhavani Shankar Kodali MD

Assistant Professor

Anesthesiology and Perioperative Medicine

Brigham and Women's Hospital

75 Francis Street, Boston, MA 02115

Tel: 617 732 8216

Fax: 617 277 2192

email: 

 You are number 1  to visit this lecture