Analysis of CO2 waveforms: 2
Clinical Aspects
Bhavani Shankar Kodali MD
Analysis of CO2 waveforms:
Prolongation phase II and III:
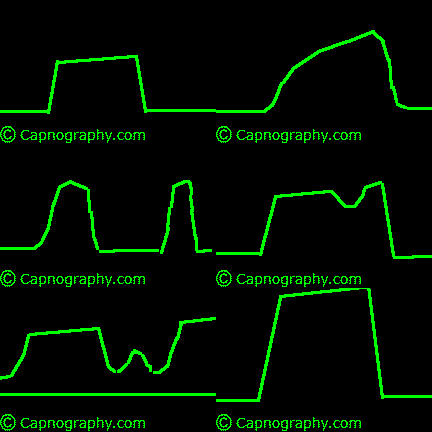
Prolongation or slanting of the expiratory upstroke phase II occurs when there is obstruction to expiratory gas flow (e.g., asthma, bronchospasm, obstructive pulmonary disease, and kinked endotracheal tube,1-9 or in the presence of leaks in the breathing system.10 A sidetream capnograph may allow gas mixing within the sampling tube (dispersion) if sampling rate is slow (50 ml.min-l) or if the tubing is too long or has too wide a bore, or both. Such dispersion of gases can also result in prolongation of the expiratory upstroke.11-13 The slope of the expiratory plateau (phase III) can be increased during pregnancy as a normal physiological variation.5,14 Besides, it can also result from factors that produce obstruction to expiratory gas flow which may also result in a prolonged phaseII.1-9
Non Pregnant |
Capnogram during cesarean section (The slope the expiratory plateau is increased as a normal physiological variation in pregnancy) |
|
|
Normal |
Airway obstruction (eg., bronchospasm). Phase II and phase III are prolonged and alpha angle (angle between phase II and phase III) is increased |
|
|
Normal |
Capnograms recorded with prolonged response time (Base line is elevated, prolongation of phase II and III, prolongation of inspiratory descending limb) |
|
|
Curare Cleft:
A dip in the plateau (curare cleft) indicates a spontaneous respiratory effort during mechanical ventilation.5,8,10
Curare cleft
A dip in the plateau indicates spontaneous respiratory effort
It can also result from surgical manipulations in abdomen |
|
Terminal dip of alveolar plateau: Dilution of PETCO2 by fresh gas flow (FGF) in circuits and ventilators using a continuous flow may result in the dilution of expired gases by the FGF’s producing a terminal dip in alveolar plateau. This results in falsely low PETCO2 values.
Normal |
Dilution of PETCO2 by fresh gas flow (use of PEEP or CPAP in IMV bird ventilators, can also occur as a result of dilution of expired gases by FGF in rebreathing circuits) |
|
|
References
1. Weingarten M. Anesthetic and ventilator mishaps: prevention and detection. Crit Care Med 1986;14:1084-6.
2. Paloheimo M, Valli M, Ahjopalo H. A guide to CO2 monitoring. Finland: Datex Instrumentarium, 1988.
3. Van Ganderingen HR, Gravenstein N, Van der Aa JJ, Gravenstein JS. Computer-assisted capnogram analysis. J Clin Monit 1987;3:194-200.
4. Weingarten M. Respiratory monitoring of carbon dioxide and oxygen: a ten-year perspective. J Clin Monit 1990;6:217-25.
5. Bhavani-Shankar K, Moseley H, Kumar AY, Delph Y. Anaesthesia and capnometry. (Review article). Can J Anaesth 1992;39:617-32.
6. Smallhout B, Kalenda Z. An Atlas of Capnography. 2nd e. Utrecht:Kerckebosch-Zeist, 1981.
7. Nuzzo PF. Capnography in infants and children. Pediatric Nursing 1978;May-June:30-8.
8. Cote CJ, Liu LMP, Szyfelbein SK, et al. Intraoperative events diagnosed by expired carbon dioxide monitoring in children. Can Aaesth Soc J 1986;33:315-20.
9. Leigh MD, Jones JC, Mottley HL. The expired carbon dioxide as continuous guide of the pulmonary and circulatory systems during anaesthesia and surgery. J Thoracic and Cardiovasc Surg 1961;41:597-610.
10. Adams AP. Capnography and pulse oximetery. In: Atkins RS, Adams AP (Eds.). Recent Advances in Anaesthesia and Analgesia. London: Churchill Livingston, 1989;155-75.
11. Pascucci RC, Schena JA, Thompson JE. Comparison of a sidestream and mainstream capnometers in infants. Crit Care Med 1989;17:560-2
12 Badgwell JM, Kleinman SE, Heavner JE. Respiratory frequency and artifact affect the capnographic baseline in infants. Anesth Analg 1993;77:708-11
13. Schena J, Thompson J, Crone RK. Mechanical influences on the capnogram. Crit Care Med 1984;12:672-4.
14. Shankar KB, Moseley H, Kumar Y, Vemula V, Krishnan A. The arterial to end-tidal carbon dioxide tension difference during anaesthesia for tubal ligations. Anaesthesia 1987;42:482-6.
From (a-ET)PCO2 gradients or differences- Alveolar dead space
Clinical Aspects
Kodali. Bhavani Shankar MD
(a-ET)PCO2 gradients or differences- Alveolar dead space
There are three important applications of (a-ET)CO2 differences.
Monitoring PaCO2
Measurements of PETCO2 constitute a useful non-invasive tool to monitor PaC02 and hence the ventilatory status of patients during anesthesia or in the intensive care unit. In normal individuals, the (a-ET)PC02 may vary from 2-5 mmHg.1-5 The PETCO2 is even more useful if its relationship to PaC02 can be established initially by blood gas analysis. Thereafter, changes in PaC02 may be assumed to occur in parallel with those in PETCO2 thus avoiding repeated arterial puncture provided there are no major hemodynamic changes or respiratory abnormalities that may alter alveolar dead space and hence, (a-ET)PC02. (For details -Physiology section)
Monitoring alveolar dead space
The (a-ET)PCO2 is a measure of alveolar dead space, and changes in alveolar dead space correlate well with changes in (a-ET)PCO2.1 An increase in (a-ET)PCO2 suggests an increase in dead space ventilation. Hence (a-ET)PCO2 is an indirect estimate of V/Q mismatching of the lung.
Monitoring clinical progress of a critical patient
In patients with severe lung disease or hemodynamic instability, the PETCO2 may not be good predictor of PaCO2 because (a-ET)PCO2 gradients vary with the changing V/Q relationship of the lungs, thus making PETCO2 measurements less reliable.6 The emphasis here is on more ABG's until the V/Q mismatch improves and a more constant (a-ET)PCO2 relationship is established. Establishment of constant (a-ET)CO2 implies a good improvement in the V/Q status of the patient.
References:
1. Nunn JF, Hill DW. Respiratory dead space and arterial to end-tidal CO2 tension difference in anesthetized man. J Appl Physiol 1960;15:383-9.
2. Fletcher R, Jonson B. Deadspace and the single breath test for carbon dioxide during anaesthesia and artificial ventilation. Br J Anaeasth 1984;56:109-19.
3. Shankar KB, Moseley H, Kumar Y, Vemula V. Arterial to end-tidal carbon dioxide tension difference during cesarean section anaesthesia. Anaesthesia 1986;41:698-702.
4. Askrog V. Changes in (a-A)CO2 difference and pulmonary artery pressure in anesthetized man. J Appl Physiol 1966;21:1299-1305.
5. Bhavani Shankar K, Moseley H, Kumar AY, Delph Y. Capnometry and Anaesthesia. Canadian J Anaesth 1992;39:6:617-32.
6. Phan CQ, Tremper KK, Lee SE, Barker SJ. Noninvasive monitoring of carbon dioxide: A comparison of the partial pressure of transcutaneous and end-tidal carbon dioxide with the partial pressure of arterial carbon dioxide. J Clin Monit 1987;3:149-54.