Physiology of Capnography
Bhavani Shankar Kodali MD
 |
 |
| Inspiratory segment | Expiratory segment |
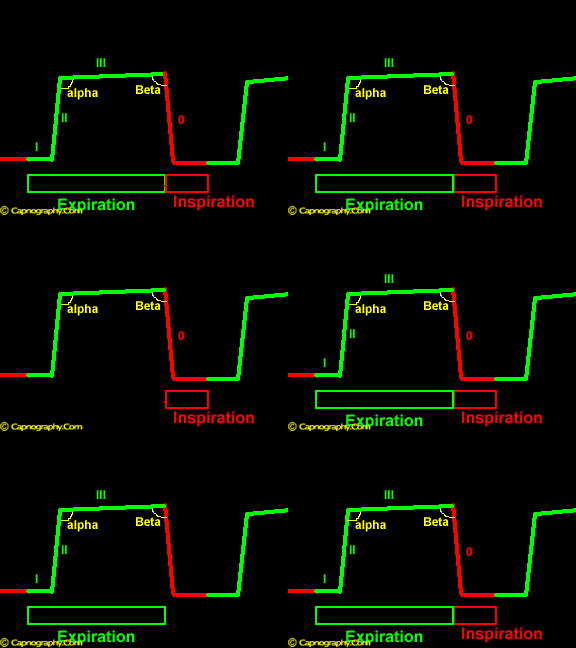
| Phase 0: Inspiration
Beta Angle – Angle between phase III and descending limb of inspiratory segment. |
Phase I – Anatomical dead space
Phase II – Mixture of anatomical and alveolar dead space Alfa angle – Angle between phase II and phase III (V/Q status of lung). |
| Alveolar Plateau (phase III) has positive slope due to |
|
Continuous excretion of CO2 into the alveoli becoming progressively smaller. Late emptying of alveoli with low V/Q ratio containing relatively higher CO2 concentration. |
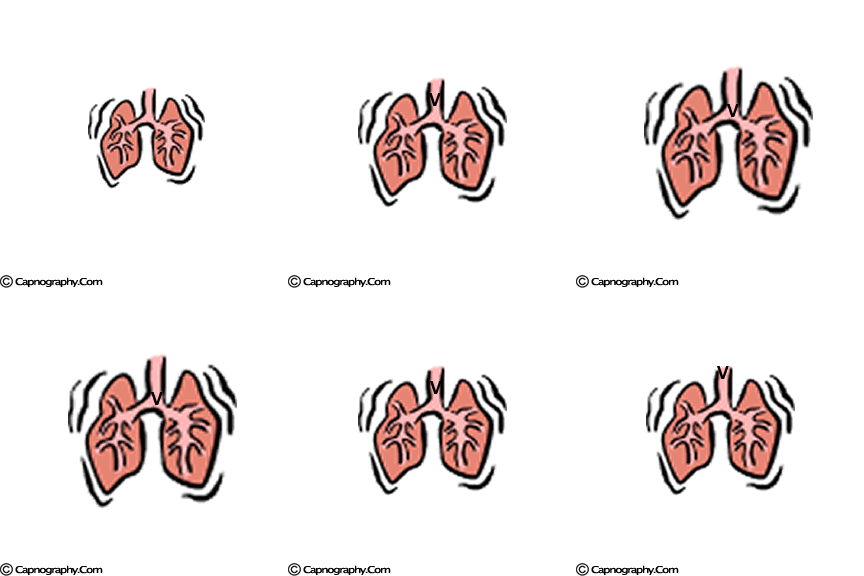
| Lower part of the lung is better ventilated | Lower part of the lung is also better perfused |
 |
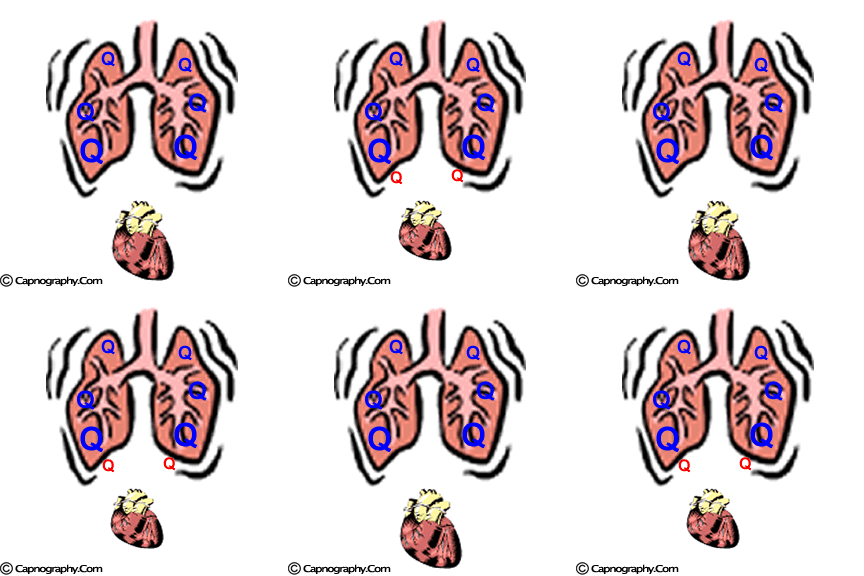 |
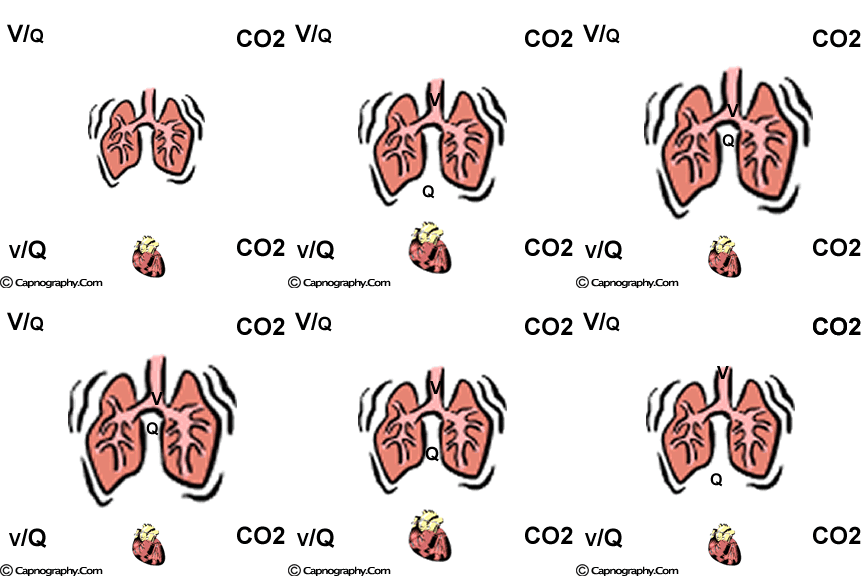
| Lower part of lung is relatively more perfused than ventilated, resulting in spectrum of alveoli with higher V/Q ratio (lower CO2) on the top of the lung, and lower V//Q (higher CO2) at the bottom of the lung |
 |
A typical time capnogram (shown above) can be considered as two segments and two angles;an inspiratory segment and an expiratory segment, and alpha and beta angles.1,2
Expiratory segment.
The expiratory segment of a time capnogram is divided into three phases: I, II, III. Occasionally, at the end of phase III, a terminal upswing, phase IV, may occur.
Phase I
Represents the CO2-free gas from the airways (anatomical and apparatus dead space).
Phase II
Consists of a rapid S-shaped upswing on the tracing (due to mixing of dead space gas with alveolar gas).
Phase III
Consists of an alveolar plateau representing CO2-rich gas from the alveoli. It almost always has a positive slope, indicating a rising PCO2 and is due to the following reasons:
(I) Steady excretion of CO2 into the alveoli.
Carbon dioxide is being continuously excreted into the alveoli which are becoming progressively smaller as expiration continues. This results in a steady increase in alveolar PCO2 towards the end of expiration, and hence contributes to a rising positive slope of phase III as expiration proceeds.
(ii) The late emptying of alveoli with lower ventilation/perfusion (V/Q) ratios and, therefore, relatively higher PC02.
If all the alveoli had the same PC02, then irrespective of the emptying patterns, phase III would be nearly horizontal. However, this ideal situation does not occur, even in normal lungs which have a wide range of V/Q ratios. Some alveoli have a higher V/Q ratio (over ventilated) than ideal alveoli and hence they have a relatively lower PC02. Others have a lower V/Q ratio than ideal alveoli (under ventilated) resulting in a relatively higher PC02. The delayed emptying of these alveoli with low V/Q (high PC02) contributes to the rising slope of phase III. The mechanisms producing this effect are:-3,4
(A) Within the terminal respiratory unit.
Ventilation:pelfusion (V/Q) mismatch within the unit may be due either to incomplete gas mixing (alveolar mixing defect) or to the fact that the maximum ventilation and maximum perfusion to that unit are out of sequence in respect to time (temporal mismatching – perfusion is highest during the latter part of expiration when ventilation is lowest). The scatter of V/Q ratios produced as a result is axially distributedwiththosealveoli having low V/Q ratio (higher PC02) being distributed distally and emptying later.
(B) Between respiratory units.
There may be a regional variation in ventilation per unit perfusion producing a spectrum of V/Q ratios (spatial mismatching). Under these circumstances, the slope of phase III is determined by the nature of emptying of the alveolar units: synchronous or asynchronous. If the units empty synchronously, the gas from well-perfused and underperfused alveoli is expired simultaneously, resulting in a horizontal phase 111 or else a phase 111 with minimal slope. However, if the units empty asynchronously, units with longer time constants, hence higher PC02, would empty later (sequential emptying) resulting in a rising slope of Phase III. The slope of the phase III is dependent, therefore, on the emptying patterns of various alveoli with different V/Q ratios as well as continuous C02 excretion into the alveoli. The relative contributions of all of the above mechanisms cannot be separated and all occur simultaneously, influencing the height or the slope of phase III. Factors, such as changes in cardiac output, CO2 production, airway resistance and functional residual capacity (FRC) may further affect the V/Q status of the various units in the lung, and thus influence the height or the slope of phase III. This attribute makes capnography a useful diagnostic tool to detect abnormalities in ventilation perfusion mismatch of the lung.
Inspiratory segment – Phase 0
After phase III is complete, the descending limb makes an almost right angle turn and rapidly descends to the base line. This represents the inspiratory phase during which the fresh gases (CO2 -free gases) are inhaled and CO2 concentration falls rapidly to zero.1,2 The segment of the CO2 trace from the beginning of inspiration to the beginning of expiration, which includes the descending limb and the initial part of the horizontal base line, can be designated as phase 0. The later part of the horizontal base line is the phase I of expiratory segment. Phase 0 represents dynamics of inspiration.
Alfa Angle:
The angle between phases 11 and III, which has been referred to as the alpha angle, increases as the slope of phase 111 increases. The alpha angle (primarily linked to variations in time constants within the lung) is thus an indirect indication of V/Q status of the lung.6
Beta Angle:
The nearly 90 degrees angle between phase III and the descending limb in a time capnogram has been termed as the beta angle.5 This can be used to assess the extent of rebreathing.5 During rebreathing, there is an increase in beta angle from the normal 90 degrees. As rebreathing increases, the horizontal baseline of phase 0 and phase I can be elevated above normal.5,7-9 Occasionally, other factors, such as prolonged response time of the capnometer compared to respiratory cycle time of the patient, particularly in children, can produce increase in the beta angle with the elevation of the baseline of phase 0 and phase I, as observed in rebreathing.10 The details of capnograms under these circumstances are discussed in section ‘Pitfalls of capnography’.
References:
1. Bhavani Shankar K, Moseley H, Kumar AY, Delph Y. Capnometry and anaesthesia. Review articel. Can J Anaesth 1992;39:517-32.
2. Bhavani Shankar K, Kumar AY, Moseley H, Hallsworth RA. Terminology and the current limitations of time capnography. J Clin Monit 1995;11:175:82.
3. Fletcher R. The single breath test for carbon dioxide. Thesis, Lund, 1980.

 Twitter
 Youtube


